


Our websites use cookies. By continuing, we assume your permission to deploy cookies as detailed in our Privacy Policy.
GA4 Glossary: Must-Know Google Analytics 4 Terms Explained
By the time this article will be published, we will have less than a month to migrate to GA4 as Universal Analytics is being replaced by GA4 on July 1, 2023. The transition to GA4 may be overwhelming for some due to the terminology changes between the two versions. That is why we have compiled this GA4 glossary—to assist digital marketers in comprehending the modified terms and the new additions.
Attribution
An important analytics metric for digital marketing campaigns, attribution lets you control how to give credit to the various marketing channels that led to the action taking place. In other words, attribution gives you control over how to define conversion for particular campaigns.
If you’re using last-click attribution, for example, the last action the user took will get the credit, which is what Universal Analytics did. GA4, on the other hand, uses data-driven attribution. Data-driven attribution looks at and analyses all the action the user has taken to end up at your website.
Let’s illustrate this difference between the attribution models with an example: If a user clicks on a paid TikTok ad 6 times and then returns to your website using Google search and makes a purchase, Universal Analytics would attribute this conversion to organic traffic, overlooking all previous activity. However, GA4 will take into account the previous visits through the ad as well and will attribute the conversion to both paid TikTok and organic website visit.
Average Engagement Time
GA4, unlike Universal Analytics, focuses on engagement instead of bounce rate. Average engagement time replaces the average time on site metric from Universal Analytics. It is the average time that users have spent on your website, excluding any time when the website was minimised or hidden within a browser window. Average engagement time is calculated by dividing the total active time of your site by the number of users.
BigQuery Export
With the BigQuery export feature in GA4, you can securely store analytics data in the cloud, enabling you to integrate GA4 data with external data sources and perform queries across multiple datasets. BigQuery offers both free operations and a free usage tier, as well as paid operations.
Cohort Exploration
Cohort exploration in GA4 allows you to analyse specific user groups over time. Cohorts are groups of users with a common characteristic or experience. By creating cohorts based on criteria like acquisition date or engagement, you gain insights into retention, conversion rates, revenue, and other business metrics. This feature provides visualisations and metrics to track cohort behaviour, identify trends, and make data-driven decisions for marketing optimisation and improved user experiences.
Important point to remember is that cohorts and segments are not the same metric. Cohorts focus on analysing the behaviour of specific user groups over time, while segments serve to filter and compare user data across the entire user population based on specific criteria. Cohorts provide insights into group behaviour, while segments enable comparisons and analysis across the entire user base.
Custom Definitions
Custom definitions in GA4 empower you to establish and configure personalised parameters for gathering pertinent data that aligns with your business or website requirements. They offer enhanced versatility in tracking and evaluating data beyond the pre-existing event and user properties provided by GA4. This customisation enables you to obtain more comprehensive insights into user behaviour, engagement, and performance, leading to a deeper understanding of your audience.
Custom Dimensions
Custom dimensions are used to collect additional information or context about events or users. They allow you to define specific dimensions to capture data such as user preferences, user types, product categories, or any other custom information you wish to track. Custom dimensions offer a more detailed understanding of user behaviour, enabling the creation of intricate segments and audience groups for in-depth analysis.
Let’s say you have an eCommerce website and want to track the payment methods used by users during their purchases. To do this, you’ll create a custom dimension called “Payment Method” and assign values such as Credit Card, PayPal, Apple Pay, or Cash on Delivery to capture the payment method chosen by each user. This custom dimension allows you to analyse user behaviour based on payment preferences and gain insights into the most popular payment methods on your website.
Custom Metrics
Custom metrics in GA4 serve the purpose of measuring and monitoring customised numerical data that goes beyond the default metrics offered by GA4. For instance, you have the option to create custom metrics to track metrics like revenue per user, engagement scores, or any other specific metric that holds significance for your business. By utilising custom metrics, you gain the ability to measure and analyse distinctive data points that are not readily available in GA4’s default set of metrics.
Now let’s say you have a mobile gaming app and want to monitor the average level reached by players. To accomplish this, you can create a custom metric called “Average Level” and assign values representing the level achieved by each player. This custom metric will allow you to measure and analyse the average level of player progression, providing insights into user engagement and their game performance.
Data Stream
In Google Analytics, a data stream refers to the continuous flow of data that originates from your website or app and is sent to Google Analytics for analysis. When you place a tracking code on your website or app, it establishes a data stream. Each property you create in Google Analytics will have its own unique data stream associated with it.
In GA4, you have the ability to set up multiple data streams within a single property. This feature is particularly valuable when you have diverse platforms, such as a website and a mobile app, and you desire separate tracking and analysis for each platform.
Furthermore, GA4 provides distinct reporting and analysis capabilities for each data stream. This means that you can access dedicated reports and insights for each data stream within your property, enabling you to focus on individual streams and evaluate their performance separately.
Default Reporting Entry
A typical user interacts with your business using different devices and platforms. For example, I might browse through your app on an iPhone at breakfast and later purchase something from your website using my laptop and through the browser. Although each activity would count as a different session, GA4 allows you control over how unique individuals are identified in reports, unifying them into a single cross-device user journey.
You can monitor users by User ID, Google signals and device, or by device only. If you don’t set up User ID reporting or use Google Signals, then your default reporting entity will be by device only.
eCommerce Purchase
GA4 tracks purchases instead of “transactions”. A purchase is recorded whenever an individual successfully completes the process of buying a product or service on your website. Each eCommerce purchase can include detailed information about total purchase value, items purchased, and other relevant data.
Engaged Sessions
GA4 defines an engaged session as a session that lasts longer than 10 seconds, has a conversion event, or has at least 2 pageviews or screenviews. These criteria help identify sessions where users demonstrate active involvement, indicating higher levels of engagement with your website or app.
Engagement Rate
The engagement rate is the percentage of engaged sessions on your website or mobile app. It is calculated by dividing the total number of sessions by the number of engaged sessions.
Let’s consider a scenario where a user lands on your website, briefly scans some content for less than 10 seconds, and then exits without triggering any events or visiting additional pages. In this case, since the user does not meet any of the criteria for an engaged session as explained above, this session would not be classified as an engaged session. If this were the only session on your website following a similar pattern, it would result in a 0% engagement rate and a 100% bounce rate.
Engaged Sessions Per User
Engaged sessions per user is calculated by dividing the total number of engaged sessions by the number of unique users. It provides a measure of how actively and frequently users engage with your website or app on an individual basis.
Monitoring engaged sessions per user over time and comparing it to industry benchmarks or your own historical data can offer valuable insights, allowing you to make data-driven decisions and implement targeted strategies to enhance the overall user experience, encourage deeper engagement, and achieve sustained growth in user engagement levels.
Enhanced Event Measurement
Enhanced measurement in Google Analytics allows you to measure interactions with your content by enabling options (events) within the Google Analytics interface without changing your tracking code. The events in question are:
- Page views
- Scrolls to the bottom of a page
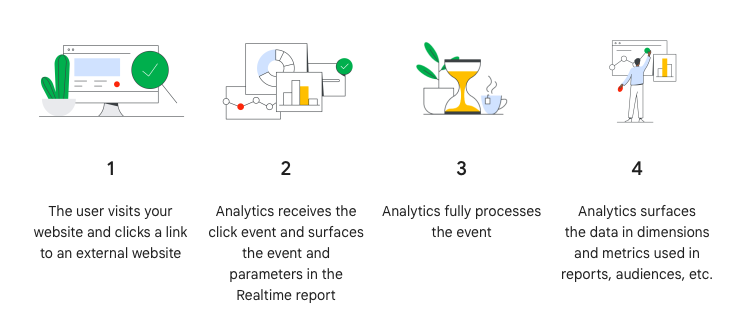
- Outbound link clicks
- Site searches
- Engagement with embedded videos
- File downloads
- Form interactions
Events
GA4 defines events quite differently than Universal Analytics. Any engagement with your website or app is now called an “event”, whereas in Universal Analytics, interactions were tracked as “hits”.
The following types of events are collected automatically by GA4:
- Automatically collected events refer to events that are automatically gathered without any additional configuration when you initially set up Google Analytics on your website or app.
- Enhanced measurement events are events that are captured when you enable enhanced measurement in your Google Analytics setup for your website or app. These events are specifically collected when enhanced measurement is activated.
The following event types are not collected automatically, so to view these events in Analytics, you must implement them yourself:
- Recommended events are implemented with predefined names and parameters. By using recommended events, you unlock existing and future reporting capabilities within Analytics.
- Custom events are defined by you to suit your specific needs. Custom events should be created only when other pre-existing events do not serve your use case. Note that custom events do not appear in most standard reports. To conduct meaningful analysis on custom events, you will need to set up custom reports or explorations.
Event Count
The “event count” metric in GA4 provides the total number of tracked events. In certain reports, it is accompanied by a dropdown menu, allowing you to select a specific event and view its corresponding data in a table format. This feature enables more focused analysis and examination of individual event data within the reports.
Event Parameter
Event parameters in GA4 are utilised to provide additional context to the events that occur on a website. They allow you to include specific details related to an event, such as the name of an embedded video or the duration of time a user spent watching a video on the website.
Events Per Session
Events per session represents the average number of events recorded per session. This calculation is obtained by dividing the total number of events by the total number of sessions. It provides insights into the level of user engagement and interaction within each session, indicating the extent to which users are actively interacting with your website or app during their visits.
Explore
In Google Analytics 4, there is a new section called “explore” that allows you to construct custom reports (known as “Explorations”) and funnels using tables and graphs. When creating a custom report, you have the option to start with a blank template and build a report from scratch, utilise a free form format, visualise a funnel, or explore user paths. This feature provides flexibility in creating tailored reports and visualisations to analyse and understand specific aspects of your data within GA4.
Explorations Snapshots
Explorations snapshots in GA4 are summary snapshots of explorations that can be created either from scratch or from templates. These snapshots provide a concise overview of the exploration’s findings and insights. By default, these summary snapshots are private, ensuring that they are only accessible to the creator or authorised users.
First User Medium
First user medium represents the first source or channel that led the user to visit the website for the first time. This metric provides insights into the various marketing channels or mediums that are driving new user acquisition and can help identify the most effective channels for attracting new visitors.
First User Source
First user source is similar to first user medium, but it focuses specifically on the source from which the user clicked through to your website. It provides information about the specific referral sources, such as search engines, social media platforms, or other websites, that drove the initial traffic to your website for a new user. This metric helps you understand which specific sources are generating the highest quality traffic and allows you to optimise your marketing strategies for better results.
Funnel Exploration
Funnel exploration in GA4 enables you to visually analyse the progression of user actions and assess their success or failure at each step of a specific task. By utilising funnel exploration, you can gain valuable insights into user behaviour and identify potential bottlenecks or areas of improvement within a user journey. This feature provides a clear visualisation of the sequential steps users take, allowing you to evaluate the conversion rates or drop-off rates at each stage.
Google Signals
Google Signals is a feature in GA4 that enables the collection of cross-device data for enhanced demographic reports and audience list creation in Google Ads. By enabling Google Signals, marketers gain valuable insights into user engagement and behaviour, tracking how users interact with a website or app across different devices. This cross-device data allows for a more comprehensive understanding of user journeys, enabling marketers to optimise their advertising strategies and deliver more personalised and targeted experiences to their audiences.
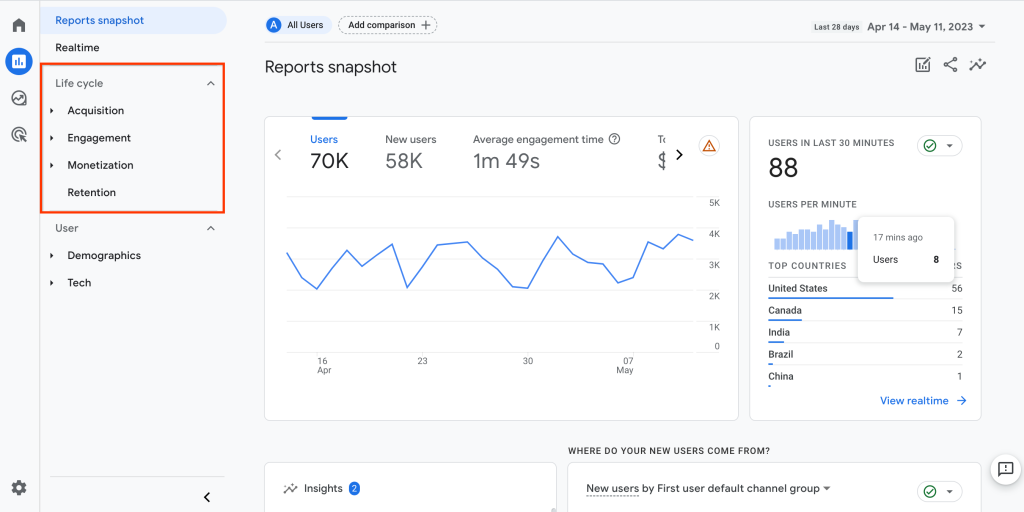
Life Cycle
Life cycle is a new reporting section in GA4 that focuses on the different stages of user journeys on your website. It provides insights into the current position of your users in their interaction with your site, offering reports on key aspects such as user acquisition, engagement, monetisation, and retention.
Measurement ID
Measurement ID in GA4 corresponds to tracking ID in Universal Analytics. Each data stream within GA4 has a distinct measurement ID. The measurement ID follows a specific format, starting with “G-” followed by a combination of letters and numbers. This unique identifier is associated with a particular data stream and allows you to accurately track and analyse the data specific to that stream within your GA4 property.
Monetisation Reports
In GA4, instead of eCommerce reports found in Universal Analytics, you have monetisation reports. These reports focus on tracking and analysing the financial aspects of your website or app. You will find these key reports under the “monetisation” section:
- Overview: Provides an overview of the monetisation performance, including revenue, conversion rates, and other relevant metrics.
- eCommerce purchases: Tracks and analyses the data related to purchases made on your website.
- In-app purchases: Focuses on tracking and analysing the data related to purchases made within your mobile app.
- Publisher ads: Provides insights into the performance and revenue generated from ads placed on your website or app.
Path Exploration
Path exploration in GA4 enables the exploration of a user’s journey through a tree graph visualisation. This graphical representation helps in identifying patterns, optimising user flow, and improving the overall user experience by understanding how users navigate and interact with your digital property.
Property
A property in Google Analytics is a container that brings together data from multiple streams to create a unified set of reports. It serves as a centralised entity within a Google Analytics account, allowing you to collect and analyse data from various sources, such as different websites, mobile apps, or other digital platforms.
By consolidating the data streams under a single Property, you can access comprehensive reports and insights that provide a holistic view of your digital presence. This enables you to track and measure performance across different channels and platforms, gain valuable insights, and make data-driven decisions to optimise your online presence.
Traffic Acquisition Report
The traffic acquisition report, located under the “acquisition” section, shows where new and returning users come from. In other words, it helps you understand where your traffic is coming from, including direct visits, organic search, referrals, social media, paid advertising, and more. This report should not be confused with the user acquisition report, which only shows new users.
User Acquisition Report
The user acquisition report provides valuable insights into how new users discover and access your website or app for the first time. Unlike the traffic acquisition report, which focuses on the sources of new sessions regardless of user status, the user acquisition report specifically examines the channels and methods through which new users are acquired.